When: July 14th, 10am-noon
Where:
- Biomedical Sciences building Room 200
- Zoom https://ucsc.zoom.us/j/95823419571?pwd=N3UzdzdnSUVtdWZXUWp3M0ZUd0JyUT09
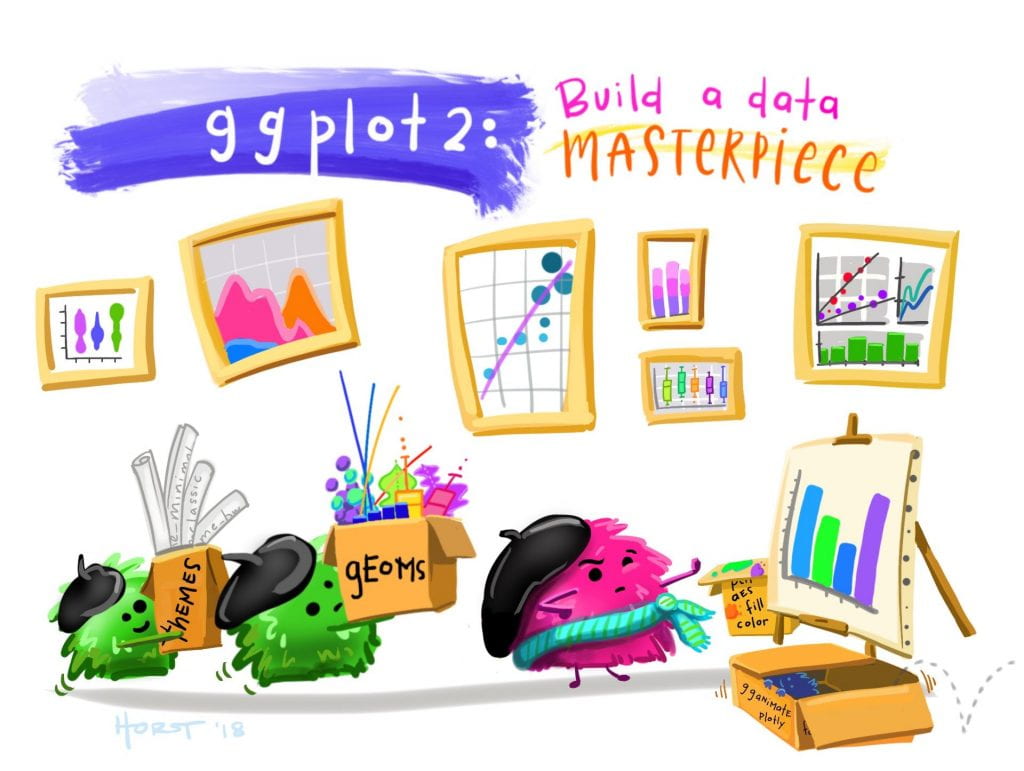
We are hosting an interactive workshop on data visualization using ggplot2 (an R package), Thursday July 14th, 10am-noon, hybrid zoom / in person on main campus
ggplot2 works especially well to plot your data in a fast and organized way, and makes it a lot easier when working with large datasets. It also has many options for visualization (plot types, colors, annotations, highlights, etc.). It’s a free package that can be loaded into RStudio (free too), is widely used in the scientific community, and has a huge amount of online resources to learn from.
Feel free to bring your own data to play with!

